 The quality of Missouri’s surface waters have improved since 2002, according to the Missouri Water Quality Report (Section 305(b) Report). The report for 2002 found that 11,284 linear miles of Missouri streams and rivers were impaired, while in 2012 it was 8,745 linear miles. Similarly, in 2002, the report found that 90,581 surface acres of Missouri lakes and reservoirs were impaired, while in 2012 it was 70,130 surface acres. The first graph shows the improvement.
Impaired means that the quality of the water is no longer suitable for one or more of its desired uses. Table 1, taken from the 2012 report, shows the types of impairments and the number of stream miles or lake acres affected. The leading problem is that the water no longer supports aquatic life or fish that can be eaten if caught.
One interesting difference between the reports is that in 2002, the Water Protection Program reported that about 21,991 miles of streams and rivers had been assessed, while in 2012 only 9,770 were. In 2002, 293,249 surface acres of lakes and reservoirs were assessed, while in 2012 only 196,200 were.
The Program traditionally focused on the chemical analysis of water that was suspected to be impaired. This strategy is most effective in monitoring the effects of point source wastewater discharges, for instance from a polluting industrial operation. However, the threats to Missouri’s surface water have changed. For instance, concentrated animal feeding operations, eutrophication of large recreational lakes, and urban sprawl have all increased, and the old strategy is not as effective with regard to these threats. The Water Quality Program has developed different monitoring strategies, it incorporates data with from variety of other agencies that are concerned with water quality, and it has developed a network of volunteers. Nevertheless, it now considers that only about 34% of Missouri’s classified stream miles are monitored.
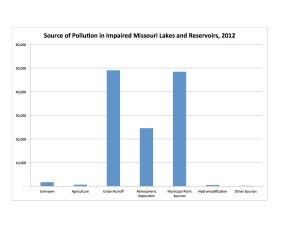
 Many sources discharge pollutants that impair Missouri’s waters. For Missouri rivers and streams the data is shown in the second graph. The source is unknown for almost 1/3 of the impaired stream miles. Where the source is known, agriculture, mining, and urban runoff/construction each pollute approximately equal stream miles. The data for lakes and reservoirs is shown in the third graph: urban runoff/construction and municipal/domestic point sources are the two largest sources.
Atmospheric deposition is the third most important source of pollution in lakes and reservoirs, and the fourth most important in rivers and streams. In particular, atmospheric deposition is a major source for mercury pollution, the most significant heavy metal pollutant. Mercury gets into the atmosphere because it is contained in small amounts in coal.  We burn massive amounts of coal to generate electricity, sending mercury up the flue into the atmosphere, where it eventually deposits into surface water. Mercury is a potent neurotoxin, and the Missouri Department of Health and Senior Services has advised children and women who are pregnant or who may become pregnant to eat no more than one meal of Missouri fish per month. (http://health.mo.gov/living/environment/fishadvisory/index.php)
More Missouri stream miles are impaired by bacteria than any other contaminant, as shown in the fourth graph. Most often, waste from animals and from humans is the cause of bacterial contamination. Eutrophication is the largest source of impairment in more Missouri lake acres, with mercury and lead pollution also constituting significant concerns.
Missouri Water Quality Report (Section 305(b) report) 2012, Water Protection Program, Missouri Department of Natural Resources, http://www.dnr.mo.gov/env/wpp/waterquality/305b/index.html.
Missouri Water Quality Report (Section 305(b) report) 2002, Water Protection Program, Missouri Department of Natural Resources, http://www.dnr.mo.gov/env/wpp/waterquality/305b/index.html.
What’s New in the 2013 Fish Advisory, Missouri Department of Health and Senior Services, http://health.mo.gov/living/environment/fishadvisory/index.php
 Mercury: Human Exposure, E.P.A., http://www.epa.gov/mercury/exposure.htm.

