The previous post showed that in Missouri the drought of 2012 was serious, but not record-breaking. In fact, the trend since 1965 has been toward fewer drought years and more years that are wetter than average.
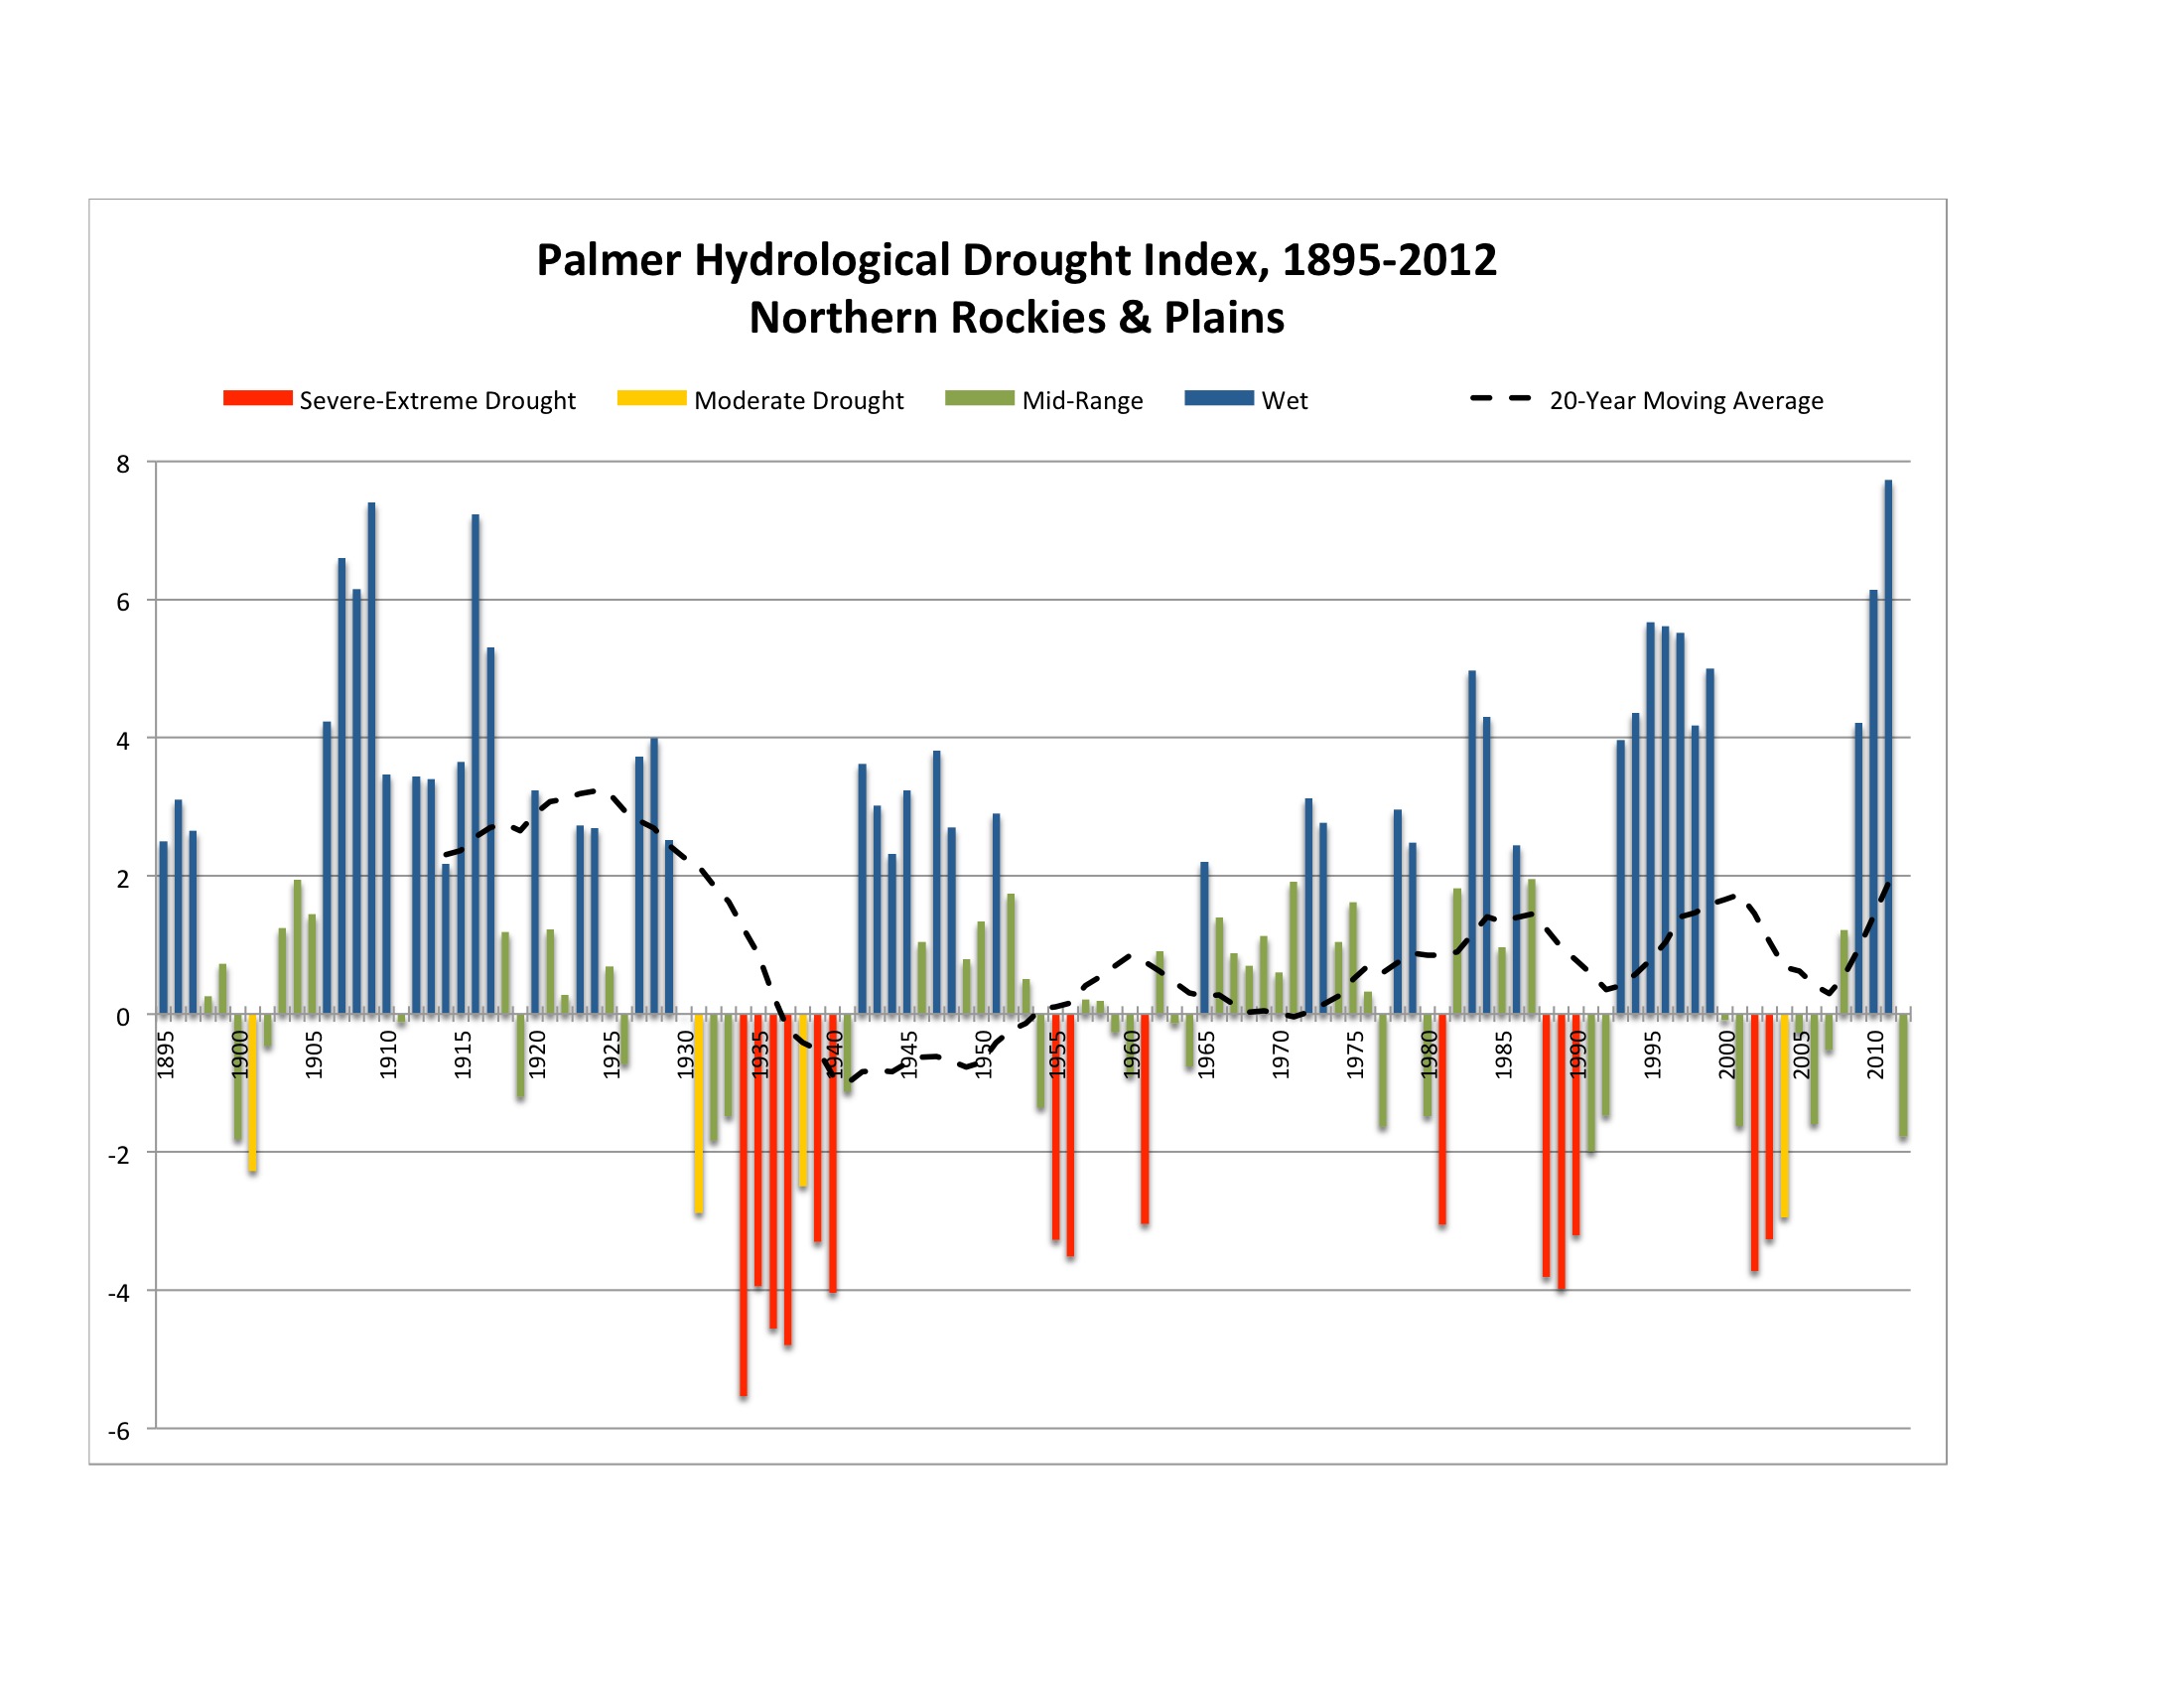 Missouri is not the only region where moisture has increased over recent decades. The first chart at right shows the Palmer Hydrological Drought Index (PHDI) for the Northern Rockies and Northern Plains from 1985-2012. Drought affects reservoir and groundwater levels slowly, and they recover slowly. The PHDI captures such long-term drought conditions.
Why that area? Because it consists of the states of Nebraska, South Dakota, North Dakota, Montana, and Wyoming. It accounts for most of the water in the Missouri River, our state’s most important source of water. In the chart, the blue columns indicate wet periods, green columns indicate midrange values, yellow columns indicate moderate drought, and red columns indicate severe drought and worse. The black dashes represents the moving 20-year average.
First, much of this region is semi-arid. The PHDI measures departure from normally expected moisture, so wet values do not mean there is a lot of water, they only mean that it is moister than the usually dry conditions. Drought, on the other hand, means a reduction in moisture from conditions that are already typically dry.
Second, notice how many columns are above the zero line compared to the number below. There are 75 years with PHDI values of zero or above, compared to 43 with values below zero. I’m not sure what this means. The overall shape of the chart shows the same moister trends recently and at the beginning of the 20th Century, with dry periods in the middle. This region suffered its worst drought during the dust bowl era.
Third, notice that the index values don’t tend to hover around the midrange, and they don’t transition gradually. This region of the country tends to flip between wet periods and drought.
Fourth, notice how long some of the wet periods and droughts are. The wet period at the start of the 20th Century lasted 26 years. The drought during the 1930s lasted 10 years. This is the famous Dust Bowl era. That drought was centered in the Oklahoma Panhandle, but it affected much of the country.
 In contrast, consider the second chart at right. It shows the PHDI for California. The 20th Century opened with a wet period, but since 1985 drought has been increasing, both in frequency and in average severity. Since 1985, 17 years have had negative PHDI readings, and 14 years have had moderate, severe, extreme, or exceptional drought.
Why California? Because it is our largest state, responsible for over 13% of the entire national gross domestic product. In terms of farming, which is so water-dependent, it produces more than half of the nation’s fruits and vegetables.
Sources:
The data for both the Northern Rockies & Plains and for California were created using a data portal at the National Climatic Data Center: NCDC > Climate Monitoring > Climate At A Glance. http://www.ncdc.noaa.gov/cag/time-series. The following selections were made:
Parameter > Palmer Hydrological Drought Index
Time Scale: Annual
Start Year: 1895
End Year: 2013
State/Region: Northern Rockies and Plains
Climate Division: Entire Region

Hello –
The article doesn’t explain what is the Palmer Hydrological Drought Index. For lay people this information may be useful.
Thank you,
Mary Aldrich
One of the most important effects of drought is dry soil. Dry soil impacts agriculture, as crops wither and yield is reduced. Dry soil also impacts water supply, as runoff into steams and lakes is reduced. The Palmer indexes attempt to estimate the moisture level of the ground by using rainfall and temperature records over a period of time, and also by using the dryness of the ground at the beginning. Less rainfall, higher temperature, and dryer ground to start with all tend to intensify a drought.
Several Palmer Indexes have been developed. The most common is the Palmer Drought Index (PDI), aka the Palmer Drought Severity Index (PDSI). This index is constructed in such a way that it measures moisture level over a medium time frame (a week to a few weeks), which is most useful to farmers trying to determine how much they need to irrigate their crops. It is the most used of the Palmer indexes.
Another index is the Palmer Hydrologic Drought Index (PHDI). This index is intended to measure soil moisture over longer periods of time (months), as those have the largest impact on runoff into streams and lakes.
For more information, try looking at https://www.ncdc.noaa.gov/temp-and-precip/drought/historical-palmers/overview.