Climate change has more than doubled the yearly area burned by wildfire in the United States.
In the decade from 1985-1994, wildfire burned 3,041,549 square miles in the USA. In the decade from 2006-2015 it burned 6,991,669 square miles – more than twice as much (see Wildfires Growing in Size, Not Number). But the number of fires has not greatly changed, rather the size of individual fires has grown. My findings parallel the results of several scientific studies and also field reports from the fire fighters themselves: wildfires, especially in southern and western mountain regions, have grown larger and more fierce. Why?
Using data to explore the change is complicated by the fact that the human response to wildfire has changed: instead of suppressing every fire as rapidly as possible, some are allowed to burn to fulfill their natural role in the forest ecosystem. It was during the 1960s that evidence of the beneficial role of fire began to accumulate, and it was during the 1970s when a change in policy began to be discussed. Yellowstone was the test site for the new policy, and it was phased in during the early 1980s. The terrible fires of 1988 changed all that, and the policy was suspended for review. It was reinstated during the early 1990s, and then it spread to other regions of the country The result was that the change occurred gradually, and not everywhere at the same time. The mid-1980s through 1990s are precisely the time of greatest increase in wildfire size. Thus, it is possible that part of the reason relates to the change in fire suppression policy. I know of no way to untangle that possibility from the data.
The change in policy notwithstanding, two other explanations are generally put forward to explain the increase: a build-up in fuel load due to the nearly century-long policy of suppressing wildfire, and climate change. The most recent studies suggest both play a role.
In Renewal by Fire I described how lodgepole pine forests age and become unhealthy if all fires are suppressed. To release their seeds, they require fire to melt the resin sealing their pine cones shut. In the absence of fire, little grows on the forest floor. Instead, downed timber builds up, forming conditions that are ripe for a large, destructive fire. Other western forests, dominated by species such as ponderosa pine or piñon pine, have different dynamics, but the effect is much the same: in the total absence of fire, fuel builds up, making conditions ripe for a severe, destructive fire.

Figure 1. Biomass Volume in Western States. Source: Rummer et al. 2003.
I could find no studies that compare the fuel loads in America’s western forests over time. I did find one study that suggested that across 15 western states there were 6.9 billion bone dry tons of fuel in the forests, of which 2.2 billion (32%) should be removed. This assessment counted not only debris on the forest floor, but also trees that should be thinned. Figure 1 shows the data.
(Click on chart for larger view.)
There may be questions about this explanation, however. The near-century of fire suppression would lead to a gradual build-up in fuel load over the entire period, rather than a sudden spike in the 15 years from 1985-2000. In addition, in recent years some fires have burned through areas burned in previous fires. For instance, this year’s Maple Fire in Yellowstone National Park partially burned through areas that burned in the North Fork Fire of 2008. Until recently, fires had difficulty burning through areas that had burned previously, there just wasn’t enough fuel. Not so in recent years. Thus, a build-up of fuel load due to fire suppression doesn’t fit the shape of the data well, and it doesn’t account for some recent fire behavior.
Weather (short-term) and climate (long-term) are typically thought to be the most significant controls over the number, size, and ferocity of wildfires. As noted in Smokers, Smolders, and Big Blowups, it is when fuel becomes very, very dry that the fire danger becomes most extreme. Fires start more easily, and they wait only for a windy day to become raging infernos.
Climate change can dry the fuel in forests three ways: it can result in less precipitation, it can cause the snowpack to melt earlier, leading to a longer dry season, and it can raise the temperature, causing the moisture in the forest to evaporate faster. All 3 seem to be occurring.
There are no data regions that correspond precisely with the areas of Wyoming and Montana that include Glacier, Yellowstone, and Grand Teton National Parks. Instead, I will share data from sub-regions and/or specific locations that we can take as representative of the whole area.
Scientific studies of the snowpack sometimes look at the flow of rivers that depend on snowmelt for their water. They use the date of maximum flow as a proxy for the date of the snowmelt. They typically show that maximum flow is occurring earlier in the year than it used to, suggesting the snowpack is melting earlier than it used to. (Westerling et al, 2006)
I am not interested in when the snow is melting the most, however. I’m interested in the date at which snow no longer covers the ground, and thus, is no longer available to moisten the ground. I know of no data set that reports this information. Instead, I have selected a date late in the season – April 15 – and looked at the snowpack on that date over time. If there is less snow on the ground late in the season, it probably indicates an earlier date when the snowpack is gone and the dry season begins.
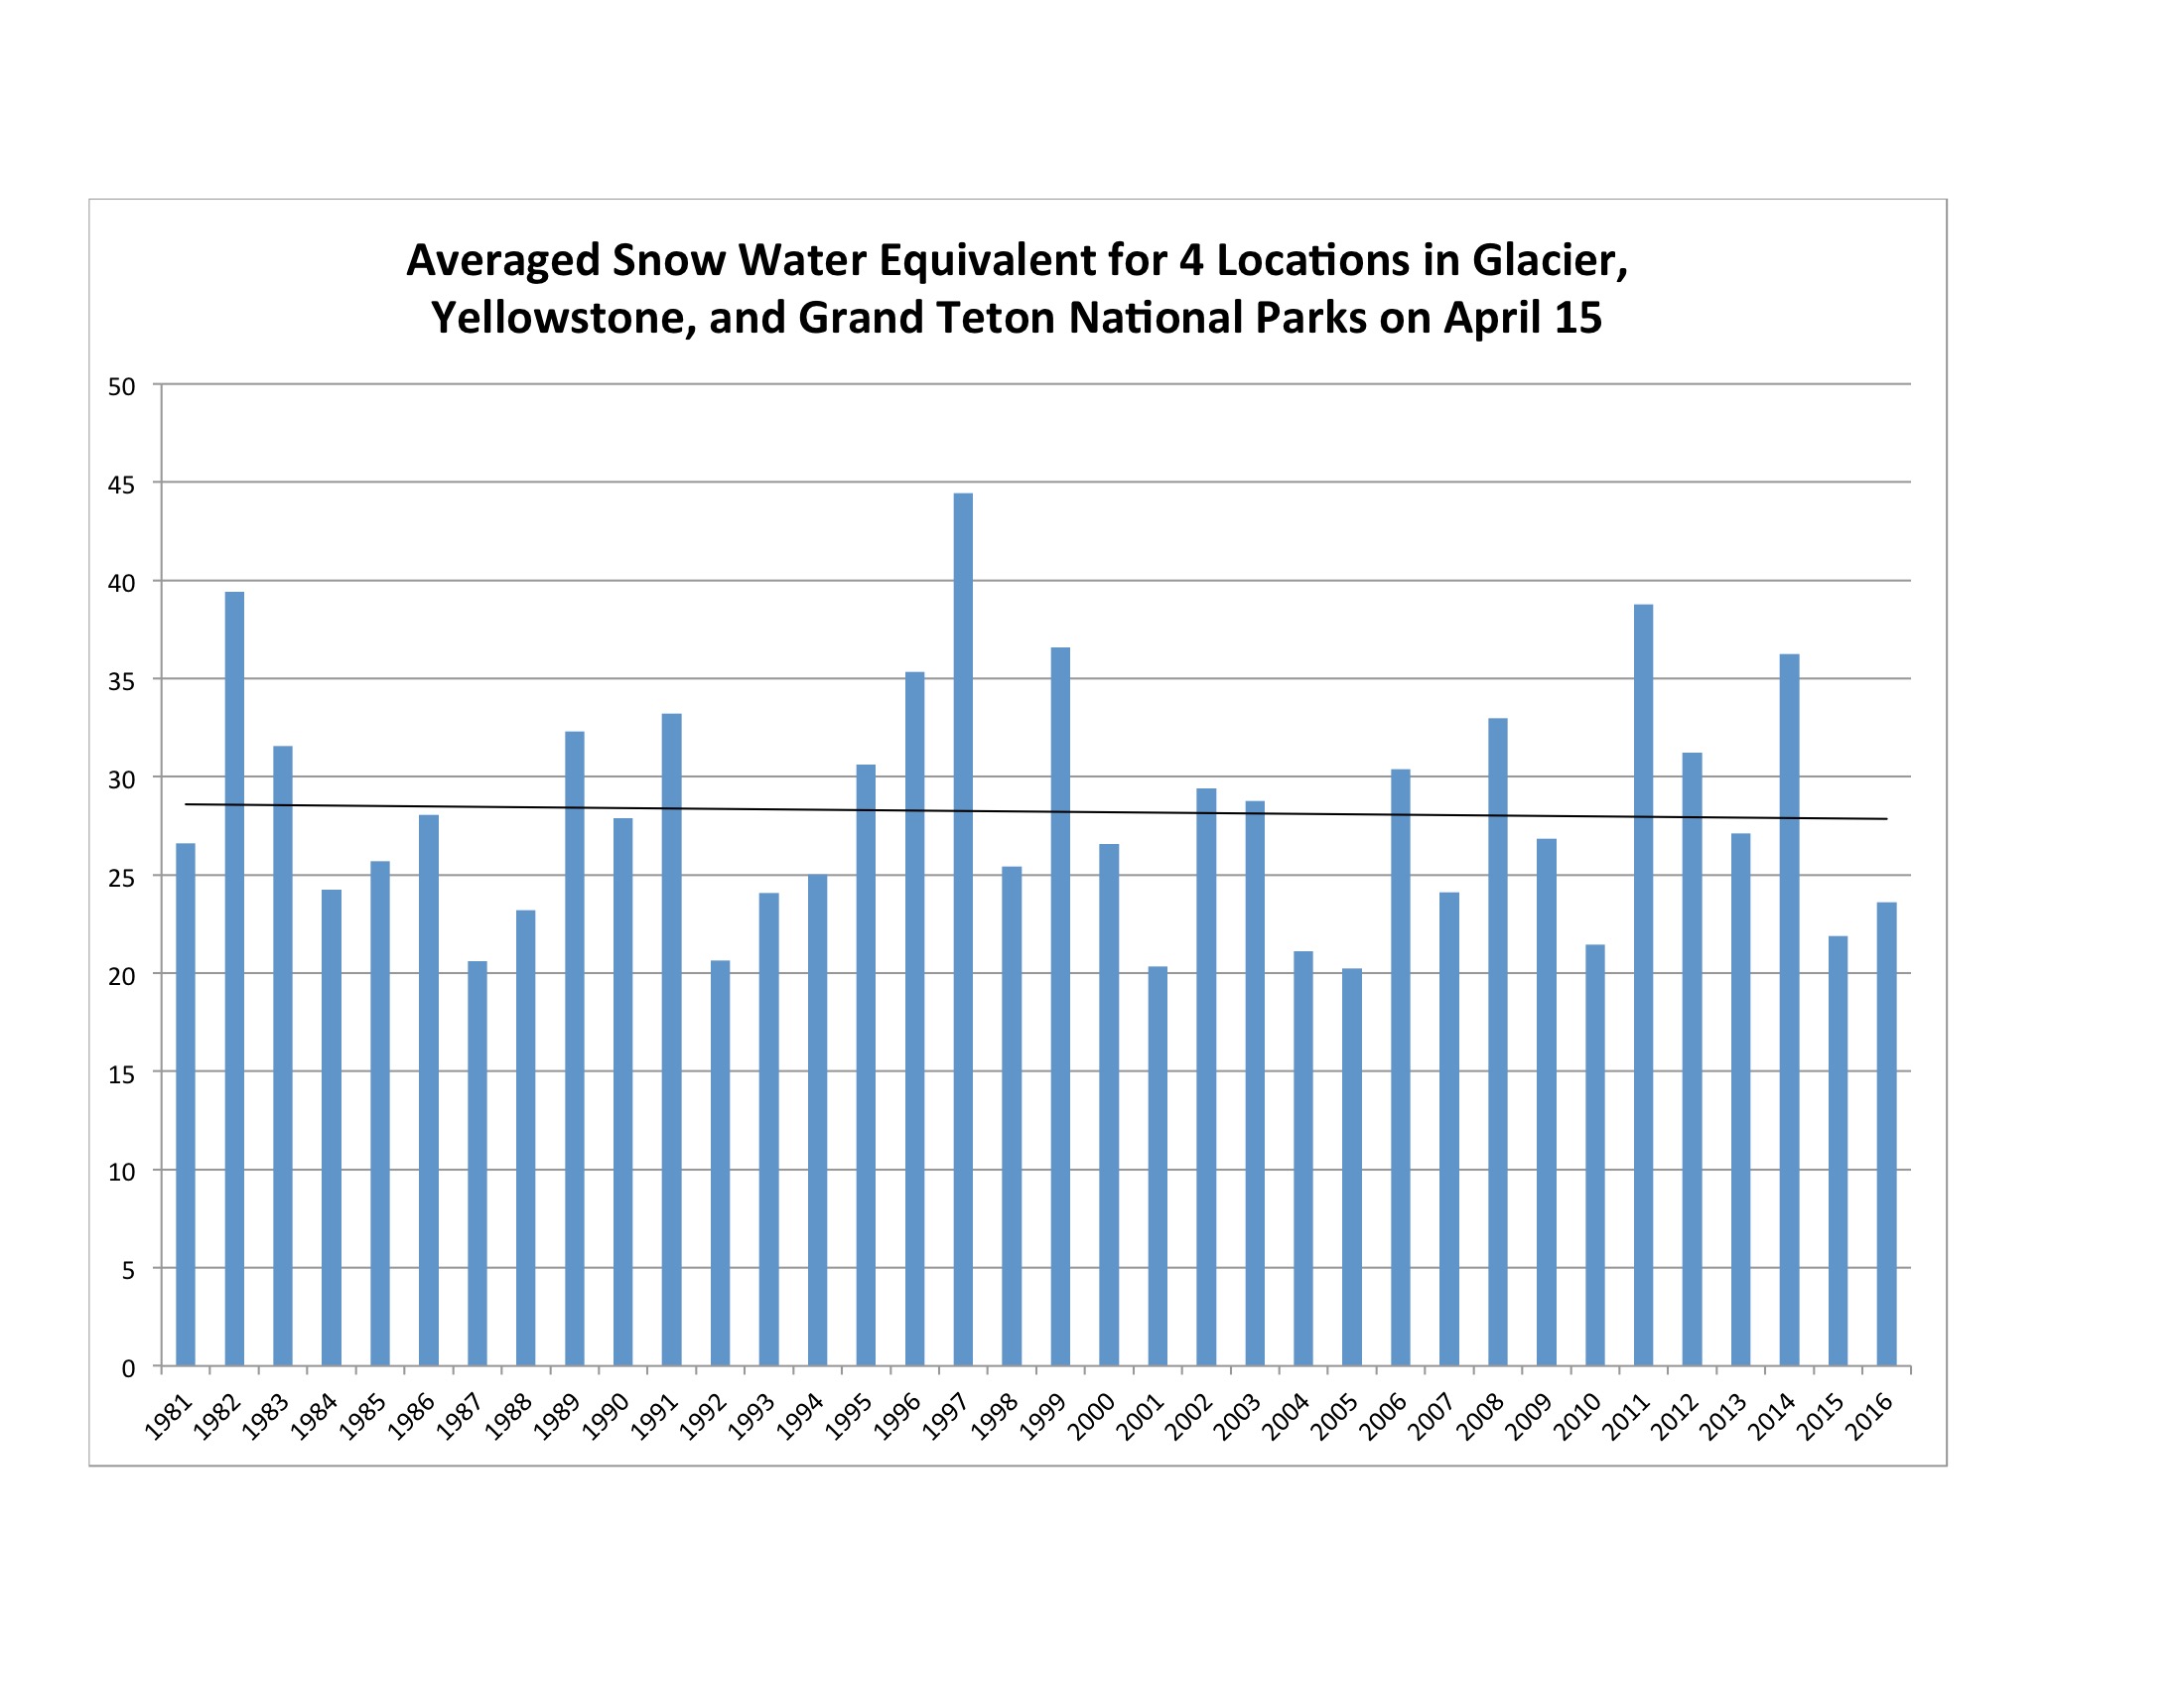
Figure 2. Snowpack at 4 Locations in the Northern Rockies. Source: Natural Resources Conservation Service.
Figure 2 shows the data. Because the amount of snow can vary greatly according to local variables, I have taken measurements from the SNOTEL stations at Grassy Lake in Grand Teton National Park, Beartooth Lake in Yellowstone National Park, Emery Creek in the lowlands of Glacier National Park, and Flattop Mountain in the highlands of Glacier National Park. I have averaged the readings from 1981-2016, 1981 being the earliest measurement at two of these locations. The blue columns represent the actual data, and the black line represents the trend. You can see that since 1981 the average snowpack at these locations has declined, but the change is very small: -0.02 inches per year. Since the chart covers 36 years, that represents a change of -0.72 inches, or 3%. It suggests that the snow free date may have shifted a few days earlier, but by itself it is probably not a large enough change to account for the increase in fire.
Figure 3 shows the annual average winter temperature in Western Montana from 1981 to 2016. Figure 4 shows similar data for summer. The purple lines show the actual readings, the blue lines show the trends. You can see that the winter temperature has increased significantly, at a rate of 0.4°F per decade. You can also see that the summer temperature has increased even more, at a rate of 0.7°F per decade. That is a very large change for such a fundamental climate variable.

Figure 5. Winter Temperature in Western Montana. Source: Climate at a Glance.

Figure 6. Summer Temperature in Western Montana. Source: Climate at a Glance.
.
Figure 5 shows the total winter precipitation in Western Montana from 1981 to 2016. Figure 6 shows similar data for summer. The green lines show the actual measurements, the blue lines show the trends. During winter, precipitation has increased marginally, at a rate of 0.10 inches per decade. However, during summer, precipitation has declined at a much higher rate: -0.65 inches per decade, about 6.5 times larger than the winter increase.

Figure 3. Winter Precipitation in Western Montana. Source: Climate at a Glance.

Figure 4. Summer Precipitation in Western Montana. Source: Climate at a Glance.
.
The data suggest that precipitation in the region may have increased slightly during the winter, but it has decreased significantly during the summer. During both periods, the temperature has increased significantly, with the larger increase occurring during summer. The effect would be that reduced summer precipitation and increased temperature would result in significantly drier conditions during the summer. In addition, the higher temperature would affect fire conditions by raising the ambient temperature. This is probably a less important factor than dryness, but it is significant nonetheless. Thus, we would expect fire season to begin earlier, as the forest dries earlier in the year, and we would expect that as the fire season goes on, fires behavior would become extreme, as the forest becomes extremely dry and hot. And this seems to be what has happened.
As noted in the previous post, data suggests that wildfire acreage burned in Missouri may not have increased in the same way it has in the western forests. Some data suggests that there has been an increase, but other data suggests that the increase comes from an increase in prescribed burns, not from nature-caused fires. In general, Missouri wildfire requires a human cause and human intervention to spread. Thus, it is unlikely to be affected by climate change in the same way as is fire in the western forests.
A recent research paper confirms the analysis here: fuel in the western forests has, indeed, become significantly drier in recent decades, and human-caused climate change is responsible for more than half of the increase. The increased dryness has more than doubled the area burned by forest fires from what would be expected without climate change. (Abatzoglou and Williams, 2016.)
Wow.
Sources:
Abatzoglou, John, and A. Park Williams. 2016. “Impact of Anthropogenic Climate Change on Wildfire Across Western US Forests.” Proceedings of the National Academy of Sciences. Downloaded online 10/17/2016 from www.pnas.org/cgi/doi/10.1073/pnas.1607171113.
National Interagency Fire Center. 2016. Total Wildland Fires and Acres. Data downloaded 10/3/2016 from https://www.nifc.gov/fireInfo/fireInfo_stats_totalFires.html.
Rummer, Bob, Jeff Prestemon, Dennis May, Pat Miles, John Vissage, Ron McRoberts, Greg Liknes, Wayne Shepperd, Dennis Ferguson, William Elliot, Sue Miller, Steve Reutebuch, Jamie Barbour, Jeremy Fried, Bryce Stokes, Edward Bilek, and Ken Skog. 2003. A Strategic Assessment of Forest Biomass and Fuel Reduction Treatments in Western States. U.S. Forest Service. Downloaded 10/15/2016 from http://www.fs.fed.us/research/pdf/Western_final.pdf.
Vautard, Robert, Julien Cattiaux, Pascal Yiou, Jean-Noel Thepaut, and Philippe Ciais. 2010.”Northern Hemisphere Atmospheric Stilling Partly Attributed to an Increase in Surface Roughness.” Nature Geoscience, 10/17/2010. DOI: 10.1038/NGE0979. Macmillan Publishers. Accessed online 10/14/16 from http://www.nature.com/articles/ngeo979.epdf?referrer_access_token=swKTAeDzYW4Kl15-TdbsINRgN0jAjWel9jnR3ZoTv0P_XZlZh9_0kSsrMp3iDVwubdoqNb5x1ysMj6Pi8WEDIGybf8d5YnWrK_K0z-rv-P5kg3zf4Xp2N303GmtI-sb1Pqxj-EgEPD2e8yP4zFLMB7MsVO75vxb45IdLL-6IGgaNxzUO-R2JVCJEQqMBo_ss1gYX8sILyKMpm8pnuA4OUXwG6FbEqe3OWYcb0RYdRPU%3D&tracking_referrer=www.nature.com.
Westerling, A.L., H.G. Hidalgo, D.R. Cayan, and T.W. Swetnam. 2006. “Warming and Earlier Spring Increase Western U.S. Forest Wildfire Activity.” Science, 313:5789, pp. 940-943, 7/18/2006. Downloaded 10/17/2016 from http://science.sciencemag.org/content/313/5789/940.full.pdf+html.
