 Maplewood is a suburban municipality in St. Louis County. It published its greenhouse gas inventory in early 2013, using 2010 as its baseline year, but also studying emissions in 2011 and 2012. Maplewood studied community emissions and emissions from government operations. The latter are a subset of the former, but municipalities break them out separately because they have direct control over their own emissions, while they can only influence community emissions indirectly. Many municipalities also want to demonstrate leadership on the issue.
Total Maplewood community emissions were 103,855 metric tons of CO2e. According to the report, this represented 13 metric tons of CO2e per capita. This is quite low. In the next post, we will see that Wildwood’s per capita emissions are low, too, and I will comment on this finding in a coming post.
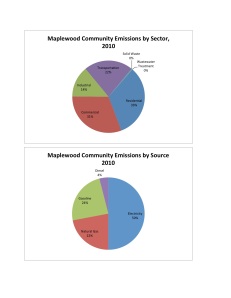
The first graph shows community emissions by sector. Emissions from residential buildings were largest, followed closely by emissions from commercial buildings. Together, emissions from the built environment accounted for 64%.
 The second graph shows community emissions and energy consumption by source. Consumption of electricity was by far the largest source of GHG emissions in Maplewood.
The third graph shows emissions from Maplewood government operations in 2010. Government buildings accounted for the most emissions, followed closely by streetlights.
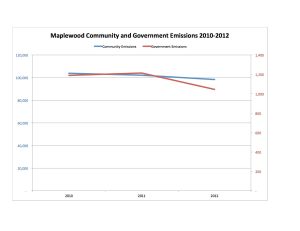
The inventory studied emissions across three years: 2010, 2011, and 2012. For community emissions, the data available across the years appears to have been largely consistent. Community emissions declined in both 2011 and 2012, for a total decrease of 5%. For government emissions, data for several months of streetlight energy consumption was not available in one year. Adjusting for the missing data, it appears that emissions increased in 2011, but decreased in 2012, for a total decrease of 12%. The data are shown in the fourth graph.
Census data shows that Maplewood did not lose a significant portion of its population during the time period, so it is unlikely that reduced population accounts for the changes. Further analysis would be required to account for them.
 My next post will focus on results from the GHG inventory in Wildwood, Missouri. After that, I will update my summary of GHG inventories in Missouri.
Sources:
Community and Local Government Operations Greenhouse Gas Emissions Inventory 2010, 2011, & 2012. As of this writing, the inventory has been adopted by the Sustainability Commission, but has not been posted on the city’s website. For a copy, contact Rachael L’Ecuyer, Director of Community Development, design@cityofmaplewood.com.
I will provide a link to the inventory when it is available on the website.
For population: Maplewood (city), Missouri, State & County QuickFacts, U.S. Census Bureau, http://quickfacts.census.gov/qfd/states/29/2945830.html.